Work that names the outcome
Top product sites show case studies with metrics. Here are three representative engagements—each image matches the product we describe.
Case study · Logistics
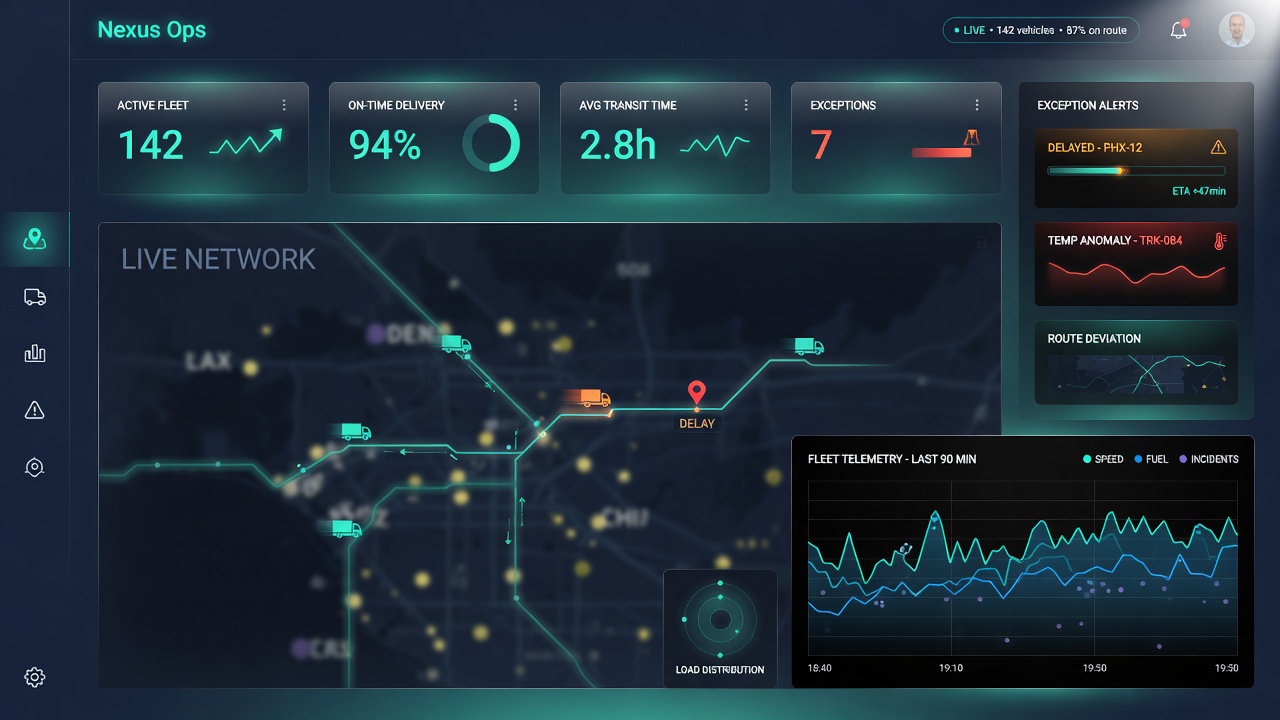
Nexus Ops
A real-time operations dashboard for a logistics provider: live fleet map, on-time KPIs, exception alerts, and telemetry—plus mobile workflows for drivers and dispatch.
Image alignment: the UI shows exactly what operators see—active fleet counts, delay pins on the live network, and exception panels for delayed or anomalous loads.
Case study · Support AI
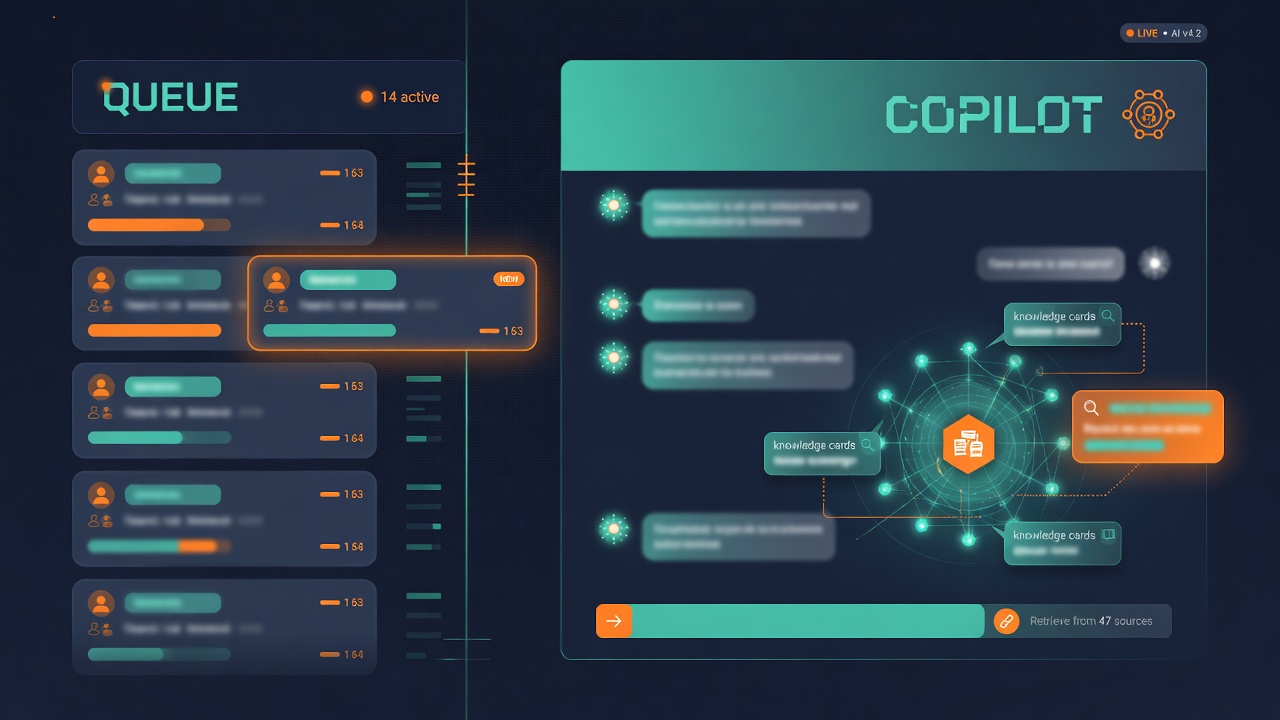
LensAI Assist
A custom AI copilot embedded in a support platform—ticket queue on the left, retrieval-backed answers on the right, grounded in internal knowledge sources.
Image alignment: queue workload, active ticket highlight, and copilot knowledge-card retrieval mirror the product story agents use daily.

Case study · Fintech ops
BridgePay Hub
A payment and billing integration layer connecting ERP, CRM, and banking APIs—unified events, reconciliation jobs, and audit-ready logs.
Image alignment: the central hub and multi-lane data flows represent the payment plane—not a generic abstract graphic.
Want results like these on your stack?
We’ll scope outcomes, integrations, and a realistic first release.
Start a conversation